


Introduction
Data comes from different sources in a format that is not ideal for either gleaning insights or building products. Hence, the need to engage in a very important activity that has to do with cleaning up and formatting our messy data and making it ready for use. The name given to this task is "data transformation." Given that data transformation takes up roughly 80% of a data analyst's or scientist's project time, it is clear how crucial it is.
In this article, I will be discussing data transformation as it relates to its application in Power BI. We shall be looking into the Power Query engine, which has been designed to carry out the data-transforming activity.
Let's take a deep dive into what Data Transformation is
When we talk about transformation, a quick interpretation that quickly pops into our mind is that there's a change of state. In the data context, we can see it as a change from messy and unformatted data to clean and well-formatted data ready to be consumed for business intelligence, model building, or other possible actions that will bring out the value embedded in our data.
To get this messy data formatted, there is an important tool that houses features that make it just possible for us to edit our data and do all manner of sorts on our data; this tool is called the Power query engine. Find attached below the image of a power query engine interface
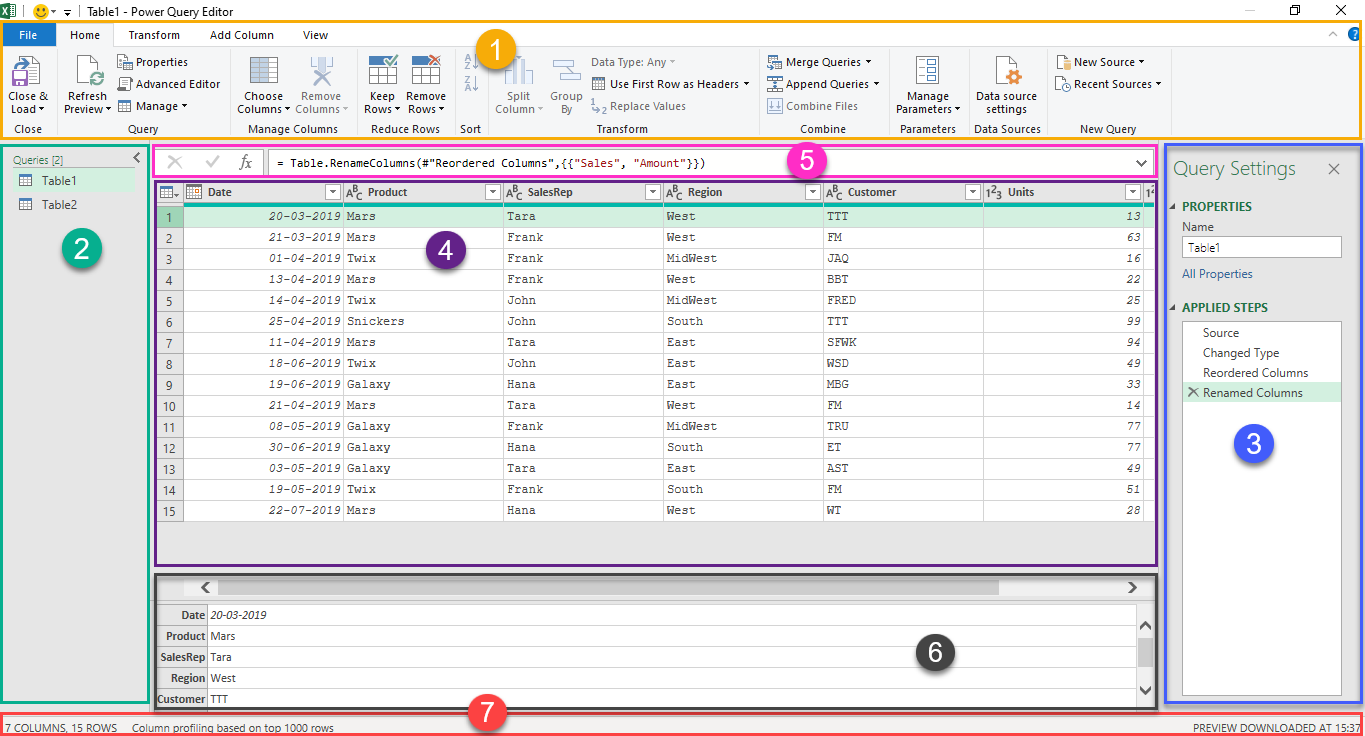
Let's run through the different areas of our Power Query editor.
1. Ribbon: The ribbon houses functions that can be used to carry out different operations on our data. There are codes running underneath them that make it possible to carry out specific tasks on our data. At the top left, you see different tabs. This tab helps group related functions. Clicking on it brings up a different view.
2. Query: The query helps display the different tables we have imported into Microsoft Power BI. We can easily switch over to either of the queries or rename them by right-clicking on any of the queries or tables we want to rename.
3. Query Settings: The query settings have two parts: the properties and the applied steps. which helps us to change the properties of our query, like name, and to save up the different steps applied to cleaning our data.
4. Data: The space that has data displays the data of the query or table we are working on.
5. Formula Bar: The formula bar displays the code, called the M Code associated with the different transformations being carried out
6. Information Display: The other two last part show information about our data. While the first shows the information of the data row selected, the second gives a basic analysis, like the total number of rows in our table.
Some key Transformations in Microsoft Power BI
In Microsoft Power BI, there are some key transformations that are quite regular. They are:
Datatype change
Renaming tables(Queries)
Renaming columns
Removing unwanted rows and/ or Columns
Merging and/or Appending tables (queries)
Replacing or removing Null values
Splitting Columns
Promoting headers
Carrying out the various actions listed places our data in the right state for further work. In my future blog post, I will be diving deeper into how we can carry out these operations against our data set.
Conclusion
Data transformation has not been this easy.
With Power BI, we have highly robust features and functions in Microsoft Power BI's query engine that can make our data transformation process painless without the need for running complex codes while still producing excellent results.